Occasional Thoughts on Educational Technology and Life by Judy Brophy

Wednesday, December 2, 2009

Visualizing Data

I've been thinking about visualizing data and remembered this great "Periodic Table of Visualization" from the VisualLiteracy.org folks that catalogs many types, from the lowly bar graph to 
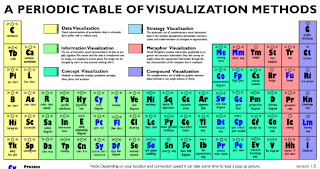
a semantic network. As you cursor over the chart you see an example of the visualization technique.

It is a great stimulus to thinking about how you want to present your data.

Wednesday, November 25, 2009

Great Tool for Travel


Roomatlas http://www.roomatlas.com/

Combines Google Earth map with Expedia's hotels with prices right on the map stickers.

You can filter by date of availability. No signup or sign on required.
Reviewed at http://mashable.com/2009/11/24/roomatlas/

To video or not to video

OK, I'm a strong proponent of desktop video for showing processes, especially software related processes. However, when I click on a link for directions I am beginning to dread seeing

What happened to text? When all you really need to know is File/Import/Browse...
a video is a waste of time.
Use video only when the list of commands gets longer than you can remember (7 steps?)